gprof
以下是从原理到实现、从全局到细节的gprof技术调研报告,包含核心代码实现和可视化分析方案:
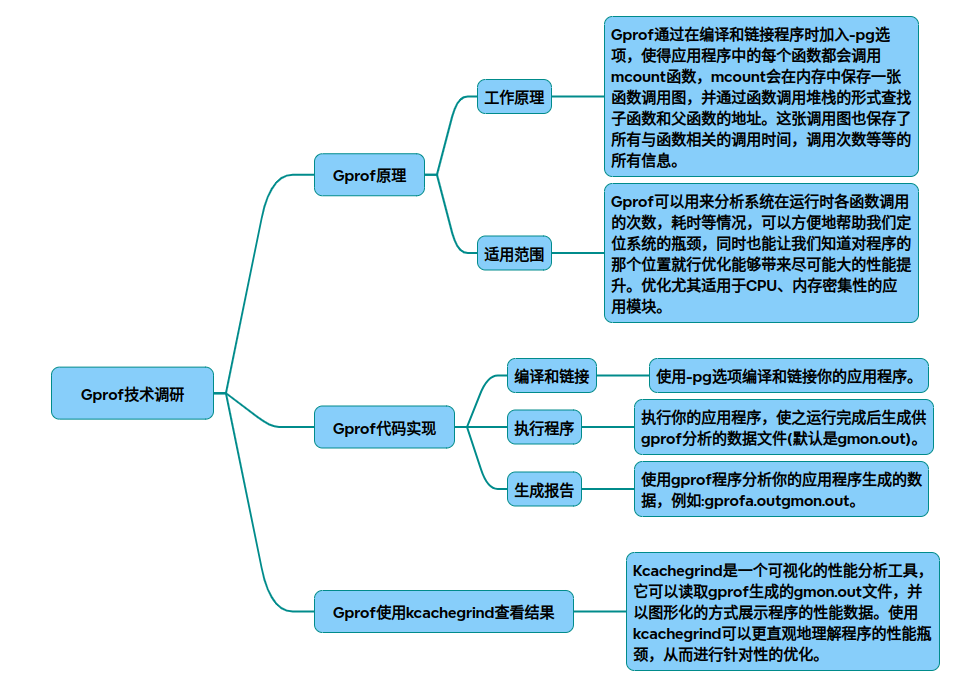
一、gprof核心原理与实现架构
1.1 系统架构图
graph TD
A[源代码] --> B[带-pg编译]
B --> C[插入mcount函数]
C --> D[运行时数据采集]
D --> E[生成gmon.out]
E --> F[gprof分析]
F --> G[Flat Profile]
F --> H[Call Graph]
1.2 核心工作原理(参考) 代码插桩:编译时通过-pg参数在函数入口插入mcount调用 调用栈追踪:
void __mcount (void *self_pc){
    // 获取调用者地址(通过寄存器或栈指针)
    void *from_pc = __builtin_return_address(0);
    // 记录调用关系图
    record_call_graph(from_pc, self_pc);
}
数据采集: * 时间采样:每10ms中断记录当前PC值(参考) * 调用计数:维护哈希表记录函数调用次数 * 动态内存分配结构:
struct profile_data {
    unsigned long calls;  // 调用次数
    double total_time;    // 总耗时
    struct child *children; // 子调用节点
};
二、完整C++示例代码
2.1 测试程序(参考)
#include <iostream>
using namespace std;

void func3(int depth) {
    for(int i=0; i<10000*(depth+1); i++); // 耗时操作
}

void func2() {
    for(int i=0; i<50000; i++);
    func3(1);
}

void func1() {
    for(int i=0; i<100000; i++);
    func3(0);
    func2();
}

int main() {
    for(int i=0; i<5; i++){
        func1();
        func2();
    }
    return 0;
}
2.2 编译与运行
g++ -pg -O2 test_gprof.cpp  -o test_gprof  # 带优化编译[8]()
./test_gprof  # 生成gmon.out
三、性能分析进阶配置
3.1 关键优化参数(参考)
| 参数组合 | 作用 | 注意事项 |
|---|---|---|
| -pg -O2 | 基础性能分析 | 避免-O3导致插桩失效 |
| -lc_p -pg | 分析C库函数 | 需安装libc-profile |
| -fno-inline | 禁用内联 | 确保函数可见 |
| -static-libgcc | 静态链接 | 避免动态库问题 |
3.2 多线程支持方案
// 使用gprof-helper.c[1]()
gcc -shared -fPIC gprof-helper.c -o gprof-helper.so  -lpthread -ldl
export LD_PRELOAD=./gprof-helper.so
四、可视化分析流程
4.1 Kcachegrind可视化(参考)
sequenceDiagram
程序运行->>gmon.out: 生成原始数据
gprof->>callgrind.out: 转换格式: gprof -b ./test_gprof | gprof2dot | dot -Tcallgrind -o callgrind.out
kcachegrind->>可视化: 加载callgrind.out
4.2 关键分析视图 调用关系火焰图:
gprof2dot -f pstats gmon.out | dot -Tsvg -o flame.svg
五、技术局限与优化建议
5.1 已知缺陷(参考) * 时间采样精度误差(±10%) * 无法分析内核态耗时(需结合perf工具) * 递归函数处理不完善(强连通分量压缩) 5.2 替代方案对比
| 工具 | 优势 | 局限 |
|---|---|---|
| gprof | 无需重新编译内核 | 多线程支持差 |
| perf | 支持硬件计数器 | 学习曲线陡峭 |
| Valgrind | 内存+性能综合分析 | 运行速度慢10倍以上 |